
10 Comments
We occasionally look at the breakdown of our supported workforce by educational degree to gain further insights into topics like age at first award, funding inequalities, and demographic diversity. Here we focus on the number of applications and awards by degree type over the past ten fiscal years (FYs) to see how researchers with these varied professional backgrounds are included in our grant portfolio.
A research workforce that draws on a variety of scientific backgrounds fosters innovation and improves the quality of the research we support. For instance, researchers with scientific, medical, multiple, or other training backgrounds may take different approaches to solving difficult biomedical research problems. This is one reason we support programs directed towards the entire biomedical research workforce, which includes clinician scientists, veterinarians, and dentists pursuing careers in biomedicine.
Please keep the following in mind when reviewing the data:
- An application or award may include an individual principal investigator (PI), or multiple researchers included on a multiple-PI application.
- The single medical degree group includes Medical Doctor (MD), Doctor of Osteopathic Medicine (DO), Other Doctor of Medicine, and Foreign-Bachelor of Medicine degrees (e.g., MBBS).
- The single scientific degree group includes Doctor of Philosophy (PhD), Doctor of Science, and Doctor of Public Health degrees.
- The dual degree group includes individual PIs with both medical and scientific degrees (such as MD-PhD), or instances where researchers on a multiple-PI application each have at least one of those degrees.
- The “Other” group may include a single PI with a degree other than those listed above, or a multiple-PI application with a combination of those and other degrees. “Other” includes: Doctor of Veterinary Medicine, Registered Nurse, Bachelors of Arts/Science, Doctor of Medical Dentistry, and Doctor of Dental Surgery degrees. These researchers are grouped together due in part to their individual small sample sizes.
- As we have before, in this blog we refer to researchers as applicants or awardees for simplicity, but NIH actually makes awards to organizations who designate researchers on an award.
Table 1 provides the number of research project grant (RPG) applications and awards broken down by degree type between FYs 2014 and 2023. Figures 1 and 2 depict the percentage of applications and awards for each degree type over that period. Of note:
- The percentage of applications submitted by PIs with single scientific degrees fell somewhat
- The proportion of applications by and awards to PIs with single medical degrees trended down (a trend which has been previously reported elsewhere)
- The proportion of applications from and awards to PIs in the dual degree and “other” degree categories increased
Table 1. Number of RPG1 Applications and Awards by Degree: FYs 2014 to 2023
| Fiscal Year | Degree | Number of Applications | Number of Awards | Application (%) | Awards (%) |
| 2014 | Single Medical | 5,542 | 1,250 | 10.9% | 13.5% |
| Single Scientific | 34,995 | 6,243 | 68.5% | 67.6% | |
| Dual Degree | 8,029 | 1,621 | 15.7% | 17.5% | |
| Other | 2,507 | 127 | 4.9% | 1.4% | |
| 2015 | Single Medical | 5,328 | 1,174 | 10.2% | 12.3% |
| Single Scientific | 35,527 | 6,503 | 68.1% | 68.2% | |
| Dual Degree | 8,532 | 1,687 | 16.3% | 17.7% | |
| Other | 2,803 | 176 | 5.4% | 1.8% | |
| 2016 | Single Medical | 5,242 | 1,192 | 9.7% | 11.5% |
| Single Scientific | 37,205 | 7,133 | 68.6% | 68.8% | |
| Dual Degree | 8,727 | 1,854 | 16.1% | 17.9% | |
| Other | 3,046 | 193 | 5.6% | 1.9% | |
| 2017 | Single Medical | 5,007 | 1,099 | 9.3% | 10.9% |
| Single Scientific | 36,594 | 6,967 | 67.8% | 68.8% | |
| Dual Degree | 9,081 | 1,861 | 16.8% | 18.4% | |
| Other | 3,323 | 196 | 6.2% | 1.9% | |
| 2018 | Single Medical | 5,025 | 1,241 | 9.2% | 11.2% |
| Single Scientific | 37,102 | 7,572 | 67.7% | 68.4% | |
| Dual Degree | 9,193 | 1,976 | 16.8% | 17.8% | |
| Other | 3,514 | 282 | 6.4% | 2.5% | |
| 2019 | Single Medical | 5,012 | 1,197 | 9.1% | 10.8% |
| Single Scientific | 36,594 | 7,379 | 66.7% | 66.9% | |
| Dual Degree | 9,211 | 1,987 | 16.8% | 18.0% | |
| Other | 4,086 | 472 | 7.4% | 4.3% | |
| 2020 | Single Medical | 4,792 | 1,178 | 8.7% | 10.4% |
| Single Scientific | 36,677 | 7,572 | 66.6% | 66.8% | |
| Dual Degree | 9,184 | 2,038 | 16.7% | 18.0% | |
| Other | 4,385 | 544 | 8.0% | 4.8% | |
| 2021 | Single Medical | 5,085 | 1,159 | 8.6% | 10.3% |
| Single Scientific | 38,651 | 7,475 | 65.7% | 66.6% | |
| Dual Degree | 10,160 | 2,047 | 17.3% | 18.2% | |
| Other | 4,976 | 548 | 8.5% | 4.9% | |
| 2022 | Single Medical | 4,554 | 1,051 | 8.3% | 9.3% |
| Single Scientific | 36,155 | 7,605 | 66.3% | 67.2% | |
| Dual Degree | 9,668 | 2,135 | 17.7% | 18.9% | |
| Other | 4,194 | 520 | 7.7% | 4.6% | |
| 2023 | Single Medical | 4,096 | 1,083 | 7.9% | 9.8% |
| Single Scientific | 34,639 | 7,408 | 66.8% | 67.0% | |
| Dual Degree | 9,290 | 2,029 | 17.9% | 18.4% | |
| Other | 3,858 | 532 | 7.4% | 4.8% |
Figure 1. Percentage of RPG Applications by Degree Type for FYs 2014-2023

Figure 2. Percentage of RPG Awards by Degree Type for FYs 2014-2023

1 RPGs include DP1, DP2, DP3, DP4, DP5, P01, PN1, PM1, R00, R01, R03, R15, R16, R21, R22, R23, R29, R33, R34, R35, R36, R37, R61, R50, R55, R56, RC1, RC2, RC3, RC4, RF1, RL1, RL2, RL9, RM1, SI2, UA5, UC1, UC2, UC3, UC4, UC7, UF1, UG3, UH2, UH3, UH5, UM1, UM2, U01, U19, U34, and U3R grant types.
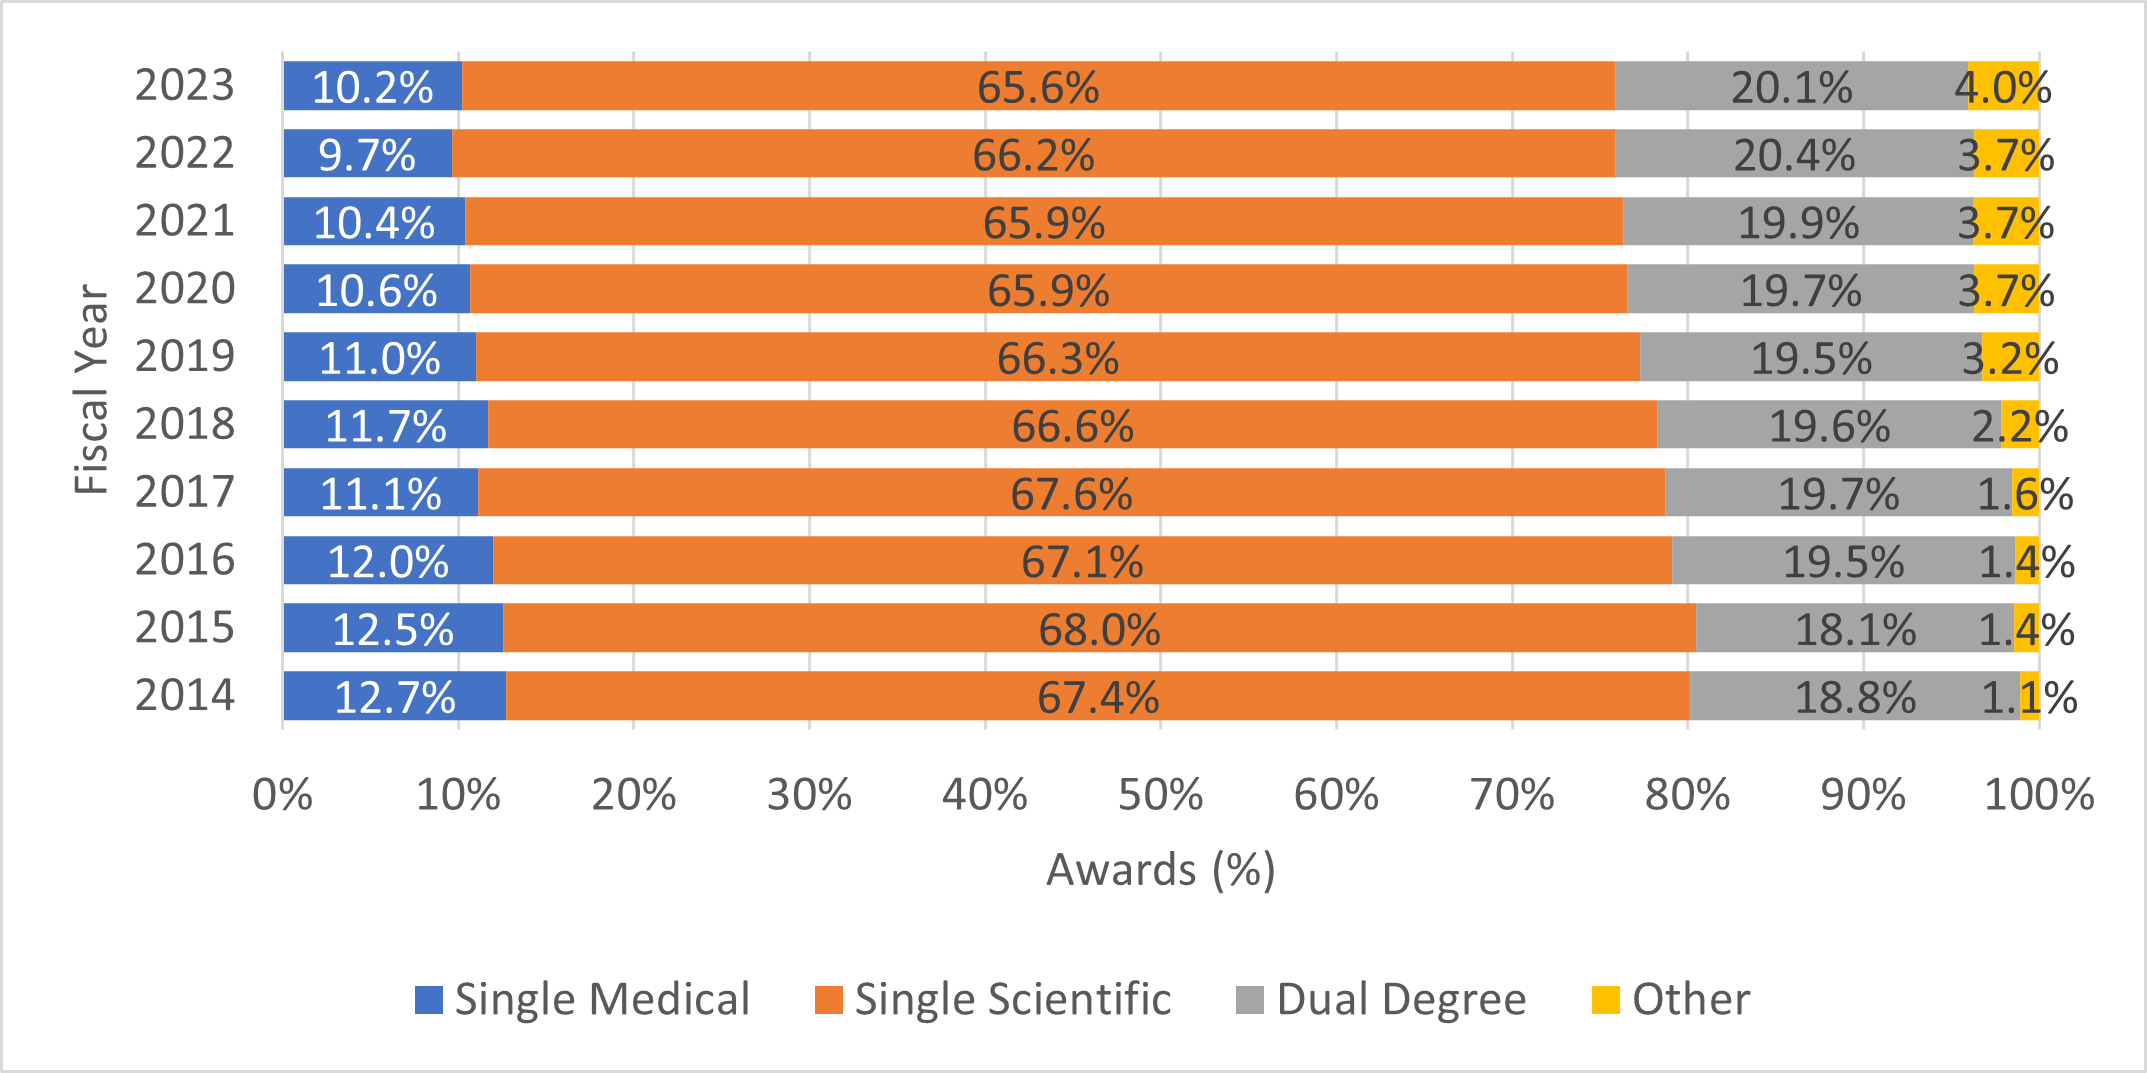
Table 2 and Figures 3 and 4 show the same data but for R01-equivalent grants. Similar to RPGs, the proportion of applications from and awards to PIs with single medical or single scientific degrees generally decreased between FYs 2014 and 2023. At the same time, the proportion of applications and awards in the dual degree and “other” degree categories increased.
Growth in the number of applications and awards for PIs with dual and “other” degrees may be related to increased NIH appropriations over the past decade or a greater number of graduates receiving degrees other than single medical or scientific degrees alone.
Table 2. Number of R01-equivalent2 Applications and Awards by Degree: FYs 2014-2023
| Fiscal Year | Degree | Number of Applications | Number of Awards | Application (%) | Awards (%) |
| 2014 | Single Medical | 3,215 | 658 | 11.7% | 12.7% |
| Single Scientific | 18,579 | 3,479 | 67.6% | 67.4% | |
| Dual Degree | 4,945 | 970 | 18.0% | 18.8% | |
| Other | 763 | 56 | 2.8% | 1.1% | |
| 2015 | Single Medical | 3,300 | 685 | 11.4% | 12.5% |
| Single Scientific | 19,409 | 3,715 | 67.0% | 68.0% | |
| Dual Degree | 5,346 | 990 | 18.5% | 18.1% | |
| Other | 915 | 77 | 3.2% | 1.4% | |
| 2016 | Single Medical | 3,231 | 719 | 10.7% | 12.0% |
| Single Scientific | 20,265 | 4,034 | 67.3% | 67.1% | |
| Dual Degree | 5,591 | 1,174 | 18.6% | 19.5% | |
| Other | 1,019 | 83 | 3.4% | 1.4% | |
| 2017 | Single Medical | 3,130 | 672 | 10.0% | 11.1% |
| Single Scientific | 21,000 | 4,082 | 67.3% | 67.6% | |
| Dual Degree | 5,937 | 1,193 | 19.0% | 19.7% | |
| Other | 1,154 | 94 | 3.7% | 1.6% | |
| 2018 | Single Medical | 3,421 | 880 | 9.9% | 11.7% |
| Single Scientific | 22,972 | 5,003 | 66.4% | 66.6% | |
| Dual Degree | 6,692 | 1,472 | 19.3% | 19.6% | |
| Other | 1,499 | 162 | 4.3% | 2.2% | |
| 2019 | Single Medical | 3,394 | 811 | 9.7% | 11.0% |
| Single Scientific | 23,117 | 4,881 | 65.9% | 66.3% | |
| Dual Degree | 6,723 | 1,435 | 19.2% | 19.5% | |
| Other | 1,851 | 239 | 5.3% | 3.2% | |
| 2020 | Single Medical | 3,347 | 827 | 9.2% | 10.6% |
| Single Scientific | 23,943 | 5,119 | 66.0% | 65.9% | |
| Dual Degree | 6,885 | 1,533 | 19.0% | 19.7% | |
| Other | 2,075 | 288 | 5.7% | 3.7% | |
| 2021 | Single Medical | 3,514 | 791 | 9.3% | 10.4% |
| Single Scientific | 24,631 | 5,030 | 64.8% | 65.9% | |
| Dual Degree | 7,477 | 1,520 | 19.7% | 19.9% | |
| Other | 2,365 | 286 | 6.2% | 3.7% | |
| 2022 | Single Medical | 3,222 | 755 | 8.9% | 9.7% |
| Single Scientific | 23,595 | 5,172 | 65.2% | 66.2% | |
| Dual Degree | 7,225 | 1,598 | 20.0% | 20.4% | |
| Other | 2,156 | 291 | 6.0% | 3.7% | |
| 2023 | Single Medical | 2,974 | 774 | 8.5% | 10.2% |
| Single Scientific | 23,028 | 4,984 | 65.7% | 65.6% | |
| Dual Degree | 7,060 | 1,528 | 20.1% | 20.1% | |
| Other | 2,010 | 306 | 5.7% | 4.0% |
Figure 3. Percentage of R01-Equivalent Applications by Degree Type for FYs 2014-2023

Figure 4. Percentage of R01-Equivalent Awards by Degree Type for FYs 2014-2023
2 R01-equivalent grants are DP1, DP2, DP5, R01, R37, R56, RF1, RL1, U01 and R35 from select National Institute of General Medical Sciences and National Human Genome Research Institute program announcements.
Although the changes presented here are small, these data do provide higher-level insights into the range of researchers with medical, scientific, or other degrees designated on NIH grant applications and awards. We will continue to monitor the breakdown of these groups to inform our understanding of the NIH supported biomedical research workforce and assess how our policies and programs may support them going forward.
I was struck by these statistics and I’m wondering if I’m interpreting the data correctly, If I calculate the success rates based on the numbers of applications/ number of awards, I get for example for the entry in Table 2, 2023: single medical 774/2974 = 26.0% ; single scientific 4,984/23,028 = 21.6%. So the success rate by having an MD (or vet or dentist degree, etc..) is about 4.5 points higher than with a PhD? Since NIH (a.k.a. disease daddy) is all about diseases, are there any statistics on how many of these awards (translational as opposed to basic science or what’s not funded) have directly resulted in cures/treatments? Or is it more about the promise of things, since most investigators applying are presumably “sufficient”.
I believe that you may be misinterpreting the tables. For Table 2 it is worth noting that the data is restricted to NIGMS and NIHGM. However, it can serve as an example for demonstration purposes. For example, the “Number of Applications” (column 3) is the number of applications submitted in that category (fiscal year-column 1, degree type – column 2) . Within a given row, one needs to take the number from the categorical cell and divide it by the sum total number for that column. That will give you the percentage of the number of applications (column 5) or awards (column 6) labeled Application % and Award % respectfully.
To determine the generally accepted success rate (percentage of applications funded, i.e. the payline), which is not calculated, included in the tables, or plotted on the bar graphs; one needs to take the number of awards and divide it by the sum total of all awards submitted (i.e. sum total from column labeled “Number of Applications”). Doing this for 2023, in Table 2, gives a payline for single medical degree of 2.2%, single scientific 14.2%, dual degree 4.4% and other 0.8% of the total payline of 21.6% (e.g. payline or percentage RO1 or equivalent applications awarded from those submitted to NIGMS and NIHGM). In comparison, for fiscal year 2014 the success rate (percentage of applications funded, i.e. the payline), for single medical is 2.4%, single scientific 12.6%, duel degree 3.5%, other 0.2%.
It would be very interesting to know whether there has been any change in the number of awards to investigators with MPH, MS, or other masters’ level or equivalent degrees. Educational attainment is not solely a reflection of smarts/capability but also of various forms of social privilege. Individuals who lack a terminal degree may function as scientific and administrative leaders in their local context but effectively be barred from applying for grant funding, due either to local institutional policies or the (presumably accurate) perception that they will not be competitive at NIH.
I am sorry that DDS and DMD degree and dual DDS/DMD+PhD are omitted
As during the recent years, data science, AI-ML technology centric projects are increasing, why aren’t computer science, data-science degrees not considered? Many times these disciplines have a more holistic view of how to combine these technologies with data and use them in more innovative way. Also, these degrees tend to have M.S. as more predominant degree. I am frustrated when I apply that my educational credentials are not even listed and denegraded to ‘Other’, eventhough I have about 20 years experience in life-sciences, have developed many Enterprise software solutions for this industry (with the help of scientists from industry of course). And even though our solutions are superior than other companies, they are not even considered simply because of PI’s Computer Science degree.
NOT EVERYTHING is created by scientists alone.
As Tax Payer, you should inquire about the bang for your buck. This might have been even more impressive to have included some analysis of the award and the recipient’s Team. Teams of consistent good research and productivity may be favored over others. This does put the new researcher at a disadvantage though. It is a complex system of rewarding and thank goodness for private philanthropy and those boards that analyze the applications. Not a perfect process for sure. Sadly the bad taste comes from professional scammers that can game the system.
This is only a minor editorial comment. The term “Doctor of Medical Dentistry” is used. There is no such degree, nor has there ever been, despite what a few websites erroneously say. “DMD” stands for “doctor of dental medicine”. This derives from the Latin, in which the adjective typically follows the noun. This is analogous to “MD” meaning “doctor of medicine”, not “medical doctor”.
I am a doctor of Optometry.
I have no PhD.
I have received NIH funding.
Are there demographics on optometrists as the degree is parallel to dentistry.
Like investigators with a degree in dentistry, investigators with a Doctorate of Optometry are included in the “other” category due to small sample size.
Is there an explanation for the steady decline in the percentage of applications and awards to single medical degree holders and the concomitant increase in the percentages for the Other category? Does this reflect a shift in single-PI applications toward MPI applications where “a combination of those and other degrees” are represented?